
Conference Papers OnlineSession 3: Visualizing the Textual LandscapePreparing the Ground, Creating the LandscapeGavan McCarthyAustralian Science Archives ProjectThis paper is a mixture of dreams and reality. This session is an exploration of the interactions between dreams and reality. Looking back on my archival career, one of the recurring themes (like a recurring dream) has been the failure of textual description to do all the things that seem to be required to comprehensively document records and make them accessible. I remember reading the discussions in the early days of the futility of subject indexing, indeed the impossibility of comprehensive subject indexing of archival records. And subsequently observing the effective abandonment of this form of documentation - it was too labour intensive, too expensive, too arbitrary, attempts at creating general thesauri were out of date before publication and became either too large to be useable or too general to be effective. Archivists, sensibly, retreated to documenting context and structure from the perspectives of creator or provenance and series or recordkeeping system. However, while this reduced the amount of data and documentation they had to deal with, it left an awful lot to be desired in terms of accessibility and there was and still is an unhealthy reliance on the knowledge individuals archivists have of the content of files, volumes, series, collections etc. I still cringe a little inside when I hear researchers praising archivists for their knowledge of the vast records under their control. While this is a laudable achievement and one that should never be completely lost it also means that the knowledge of the records is not in a system or in a form that will outlive the working career (or the memory) of that archivist with those particular records. Ideally, what we should have is a system that can communicate this knowledge to the user, no matter how far they are removed in time or space, so they can achieve both the overview and the detailed understanding required to find the materials they need for their particular purpose. (But note that I am not suggesting that people - indeed archivists - do not have a critical role in the system.) I am not a textual person - I have great difficulty in writing (well I have been very slow to develop this particular skill). I see things in patterns and conceptual groupings, complex relationships have a virtual existence in my poor brain that is certainly beyond textual or numeric portrayal and sometimes seem to beyond graphic expression as well. Like many people, part of my memory is geographic - I remember where things are by linking them to the physical environment in an unconscious way. As a rookie archivist after relocating some 6km of records in the late 1970s I was able to locate materials not through conscious memory but through immersion in the physical environment and letting my "instincts" direct the search. This was a revealing experience for myself but also useful for the archives as it enabled very speedy retrievals. However, it only underlined the vulnerability of an overall management system that was to person dependent and helped explain to me why things got "lost" (misplaced - geographically embarrassed) and later re-discovered in archives generally. It finally gave me an understanding of how, for example, an extraordinarily valuable Mozart manuscript could lie in a German archive for over a hundred years to be re-discovered not by the archivist but by a researcher. This issues I am going to cover in this paper stem directly
from these experiences but are based on these axioms:
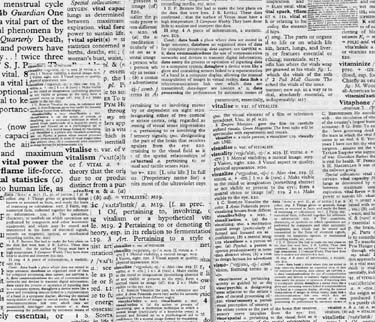
More than a Mind can Cope withIt is very easy to demonstrate the limitations of text and numbers. Take a page, any page, from the Melbourne Street Directory (Melways).
Imagine what you would have to do to take all the information packed into this single page and turn it into text and numbers. No, that is even too difficult, imagine taking a single road that travels the length of the page and then documenting the road itself, its route number, its length, the trams that run along it, the house and shop numbers, it size (arterial, freeway, local etc.), the intersections with all the roads it crosses, the distance between intersections, all the bends in the road, the traffic lights, the tram stops, the bridges, the overpasses, one way restrictions, the use of the adjoining land (shops, schools, churches etc.), railway lines. Imagine all of this information in a narrative free text description written from the perspective of a journey along the road - the quantity of words would be enormous and the single perspective from which the reality is documented would make use suitable for some but for most it would be a nightmare. Even if the information was fielded and placed in a database you are still not much better off. You may be able to offer a variety of perspectives but the amount of text you would have to read and remember to develop a visual image of map would be beyond the scope of all but the most exceptional of us.
Look what happens when we remove colour from the map. Although much of the information is still present in the form of shading, its interpretation requires more detailed investigation and is not immediately available at a glance.
Reductio ad absurdum. However, this is exactly what we expect archivists, records managers and their users to do. We use text and numbers to document a reality that is far more complex, multi-layered, interrelated and variable. This is fine, however, (for the time being that is for this is the best we can do) and if we looked at the data that underpins a Melways map we would find it in the form of text and numbers in a multi-level database. But it is more than the mind can cope with to assimilate all this textual and numeric data and build a visual image or overview that enables intelligent, knowledgeable and confident use. Archivists and records managers get around this problem to a certain extent if they deal with the records directly and have visual memory or micro-geographic memory of the records, their files, their systems of management (both micro and macro), their boxes, their computer / network architecture and software - all of those things that make records the real things that they must be. Those that are not so fortunate to have direct experience of the records and are removed in space and or time from them rely on the documentation of the records for management and access. However, there are quite sever limits on the quantity of information that can be communicated quickly and accurately in text and numbers. ASAPs experience with the records of the SECV and Generation Victoria are a clear testament to this problem. The client required a certain level of documentation to enable them to meet their needs and this resulted in a significant amount of documentation in a multi-layered relational database format that has enabled them to successfully use the records for a variety of business needs. However, the PROV when confronted with this level and quantity of data found that it was beyond the resources they had available to understand the complexity of the reality which generated the records and enabled their retention. Indeed, although we toyed with ways of generating visual summaries and overviews it was way beyond our resources to take the next step. We were left with a sense of frustration that while we had done so much and pushed the boundaries of documentation and provision of service, we were still short of the goal. The exciting thing was that we realised that we had the raw data to visualise the records. We had collected data covering a broad number of parameters (going way beyond file title) that would enable a 3 dimensional landscape or streetscape to be created. We also had enough related fields of data that would enable the use of colour and texture to further enhance functionality. The records themselves are the key to this complexity, especially if they are documented in way that captures the context of their creation and use. The Shape of Things to ComeSo the question remains as to what a data visualised archival landscape might look like ? There are probably many ways that the various parameters captured during the documentation of records could be turned into geometric shapes or indeed non-geometric shapes and forms.For this presentation I am going to concentrate on one possible interpretation, one view, one type of landscape. However, the same underlying data could be visualised in many ways and it may take some time to find the forms, shapes and views that will communicate most effectively. Indeed we will probably produce radically different visualisations for different purposes from the same data. The key to all of this, of course, is getting the data structures right - but more of that later. When Henry Gardner first proposed (over a few beers at the Wig and Pen) the use of the Wedge as means of representing archival documentation in a virtual world, my imagination latched immediately onto the notion of a 3-D Archival Streetscape. ASAP had already incorporated a 2-D bar-chart graphing of quantity against date. Thus crudely but effectively transforming a simple date-range statement into a much more meaningful piece of information that showed the relevant quantities in defined time periods through that range. We described these as profiles.
 These profiles could be produced for the complete set of records controlled by an onQ - ADS as well as for subsets within the ADS. For example each Series could have its own date profile, each provenance or creator entry could have its own profile, in fact any other construct that was linked to the Inventory could have a profile created. The Series StreetscapeImagine a set or collection of records:
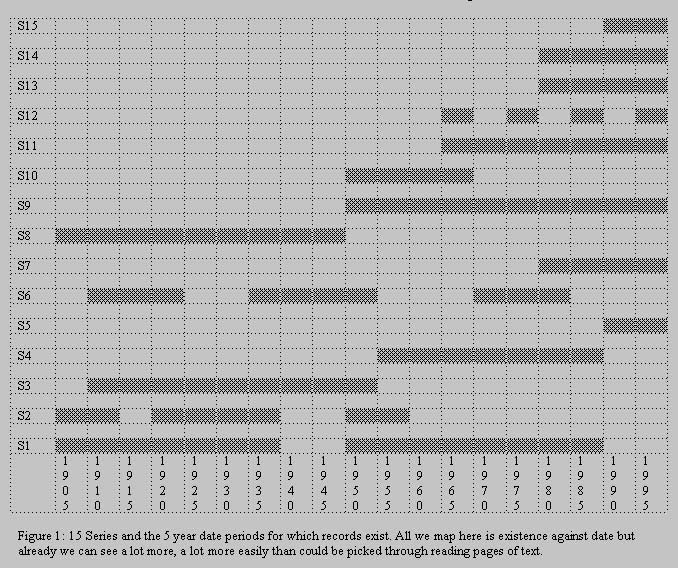 Figure 1? - 15 Series showing the periods from which records still remain. This is a good start ... but if we shade the boxes to represent relative quantity then the view becomes a lot more interesting and communicates much more.
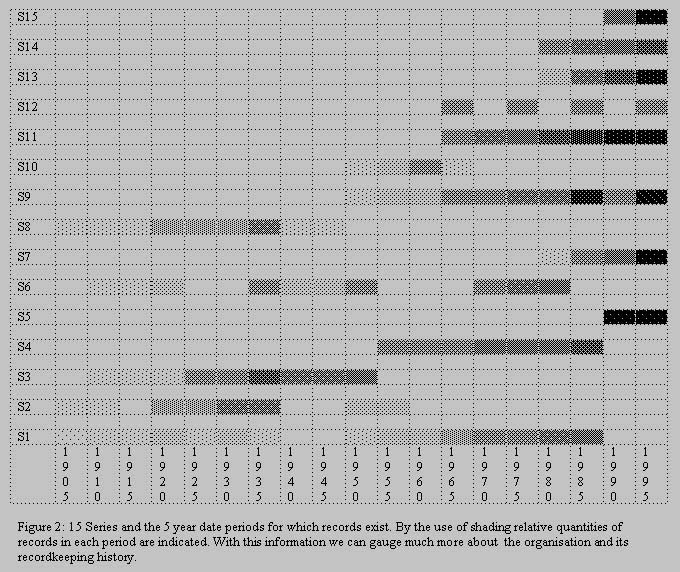 However, what we cannot see here are the relationships between the Series, the absolute quantities, the provenance of particular Series (the organisation may have been heavily divisionalised), record formats to name a few parameters. What if what we are looking at is only 15 series from the organisation which is actually made up of 300 ? How do we get the bigger picture, the overview without loosing too much of the detail to make it less meaningful ? Imagine now a 3-D graphic streetscape:
For those who have already viewed "the Wedge" you will hopefully be aware of the quantum leap it takes from the simple 2-D computer screen. In the Wedge one appears to be in an environment that is broader than the human field of vision, that has depth that goes off to infinity. We now have the scope to represent multi-dimensional data in a broad contextual landscape. Preparing the GroundOne of the key elements that will determine the success of a archival or records data visualisation will be the ability to move through the various levels of documentation - to zoom in and out and ask questions of the landscape in a dynamic way.The system should be able to take us from the general to the specific, from a collection level or group level, or agency level or jurisdictional level to a variety of series levels, to the inventory level (the unit of archival management) to the records themselves. If this is to occur the key issue is not the definition of the levels as they are relative and variable but that the same data structures and elements are used to describe the records that comprise each level. If the Inventory (or the unit of archival management) contains all the relevant information in terms of quantity, structure and content then it is possible to condense this information so it can be used at higher or summary levels. However, if the records are not documented sufficiently at this level then the system will be quite limited in its capabilities. The structure of ASAPs onQ - ADS is well suited to this purpose as the Inventory is used as the key link for the higher level relationships and key variables such as quantity is documented accurately at this level. However, even the documentation of quantity poses some interesting challenges when we attempt to integrate and compare quantities in the analogue and digital worlds. But that is subject of another paper at another time. ConclusionIn conclusion, data visualisation and products like "the Wedge" offer us a whole new world of possibilities to integrate archives and records (and other textual and numeric data sets) into the communication technologies of the Information Age.Some of the foundation work has been done but what is now required is significant funding for the applied research to develop the products, establish the metadata standards for visualisation and get into the market place. I believe that Australia is in a unique position to take
a world lead in this field at this time but it will require the industry
to get behind the key practitioners and visionaries and support their endeavours.
The key and defining element of the Information Age will be . . . Information
. . . and lots and lots of it - more than we can keep in our heads and
more than can be managed in just text and numbers.
|

Published by: Australian Science Archives Project on ASAPWeb
Comments or questions to: ASAPWeb
(asapweb@asap.unimelb.edu.au)
Prepared by: Helen Morgan
Graphics by Lisa Cianci
Date modified: 7 October 1999